Timing
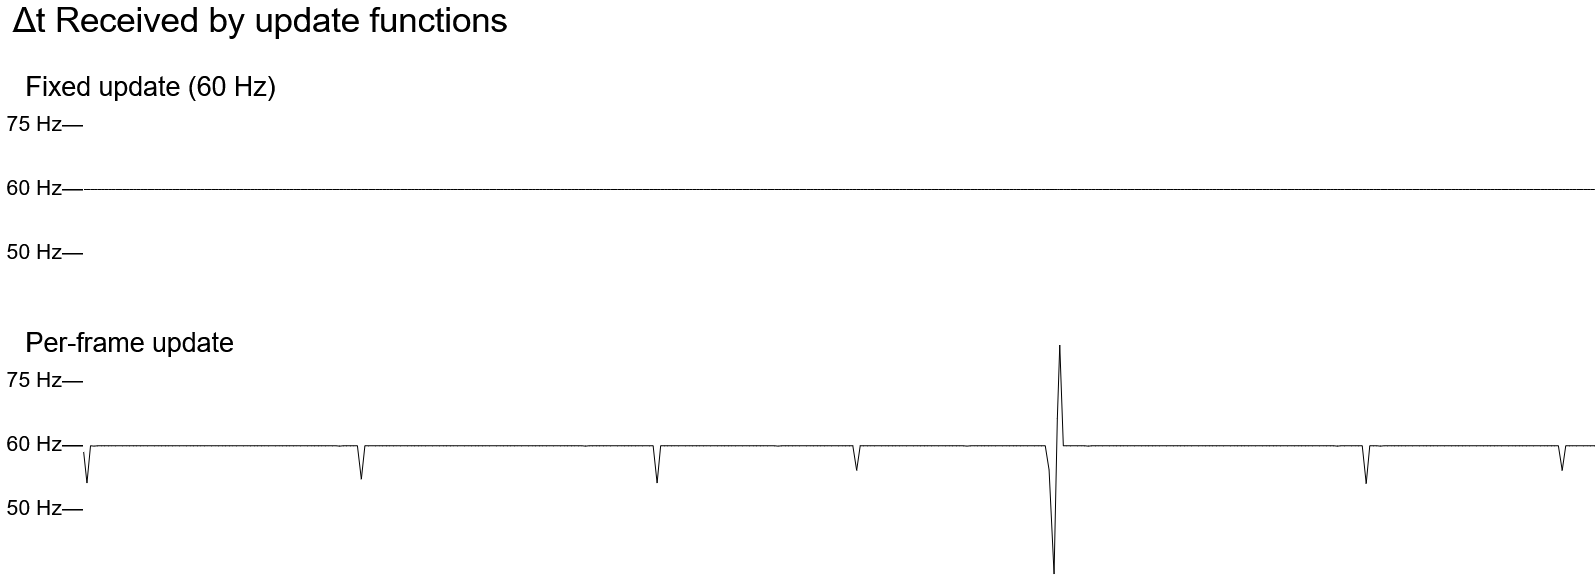
This example demonstrates the difference between the timing of per-frame and fixed-rate updates using a graph of the frequency (Hz/frames per second) that the delta time value corresponds to.
It begins on the left and moves to the right, and when it reaches the right edge of the view box it restarts from the left, overwriting the old chart.
Update function
The two update types share a function in this example:
behavior: defaultBehavior
  { render = render
  , update = saveDelta @"reg"
  , fixed =
      { interval: hz 60.0
      , function: saveDelta @"fixed"
      }
    }
saveDelta :: forall @l t r. IsSymbol l => Cons l Number t r =>
  Delta -> Scaler -> { | r } -> Effect (Maybe { | r })
saveDelta { delta } _ = pure <<< Just <<< set (Proxy @l) delta
This uses a Proxy representing a key of the state record to set that key’s value to the delta from the Delta record.
TextMetrics
This example uses custom definitions for TextMetrics and measureText to clear the canvas behind the text (most of the canvas is not refreshed each frame, but text gets messy if it’s drawn on top of other text).
Most of the TextMetrics attributes are relative to the text alignment and baseline of the canvas, so toRelativeBoundingRect converts them into a rectangle:
toRelativeBoundingRect :: TextMetrics -> Rect
toRelativeBoundingRect
  { actualBoundingBoxLeft
  , actualBoundingBoxRight
  , actualBoundingBoxAscent
  , actualBoundingBoxDescent
  } =
  { x: -actualBoundingBoxLeft
  , y: -actualBoundingBoxAscent
  , width: actualBoundingBoxRight + actualBoundingBoxLeft
  , height: actualBoundingBoxDescent + actualBoundingBoxAscent
  }
This rectangle is in canvas coordinates and relative to the coordinates of the text, so it needs to be shifted by the position of the text after scaling to the canvas:
let { x, y } = position *~> canvas
relative@{ width, height } <- toRelativeBoundingRect <$> measureText ctx text
clearRect ctx { width, height, x: x + relative.x, y: y + relative.y }
fillText ctx text x y
Sample output